For the wider trend, see our China tomato paste export data review. August adds an important change to the late-season slowdown: more tons moved, but the recovery varied sharply across destination markets.
August Volume Recovers, with Unit Value Near US$705/ton
August shipments increased by 5,150 tons from July, ending two consecutive monthly declines. Export value rose 12.2%, slightly faster than volume, while average export unit value increased just 0.6%, from US$701/ton to US$705/ton.
The rebound recovered 34.1% of the volume lost between May and July. August was still 16.7% below May and 0.5% below June. Shipments have moved off the July low, but the pace remains below the stronger months earlier in the year.
January-August 2026 Export Volume and Unit Value
August and January-August Year-on-Year Comparison
Monthly and year-to-date comparisons use matching periods. Period unit values are weighted by export volume.
| Period | 2025 volume | 2026 volume | Volume YoY | 2025 avg unit value | 2026 avg unit value | Unit value YoY |
|---|---|---|---|---|---|---|
| August | 43,139 tons | 49,843 tons | +15.5% | US$689/ton | US$705/ton | +2.3% |
| January-August | 453,976 tons | 424,558 tons | -6.5% | US$666/ton | US$674/ton | +1.3% |
August export value was 18.2% above August 2025. January-August exports totaled 424,558 tons and US$286.36 million, down 6.5% and 5.2% respectively. The weighted average unit value was US$674/ton, up 1.3%.
The positive August comparison narrows the cumulative shortfall, but the year-to-date decline still points to a slower overall shipment pace. One stronger month does not yet establish a sustained expansion.
January-August 2026 Monthly Data
| Month | Export volume | Export value | Avg export unit value | Volume MoM | Unit value MoM |
|---|---|---|---|---|---|
| January 2026 | 54,178 tons | US$36.95 million | US$682/ton | n/a | n/a |
| February 2026 | 50,919 tons | US$33.42 million | US$656/ton | -6.0% | -3.8% |
| March 2026 | 56,188 tons | US$38.21 million | US$680/ton | +10.3% | +3.6% |
| April 2026 | 58,811 tons | US$38.05 million | US$647/ton | +4.7% | -4.9% |
| May 2026 | 59,817 tons | US$38.32 million | US$641/ton | +1.7% | -1.0% |
| June 2026 | 50,109 tons | US$34.91 million | US$697/ton | -16.2% | +8.8% |
| July 2026 | 44,693 tons | US$31.34 million | US$701/ton | -10.8% | +0.6% |
| August 2026 | 49,843 tons | US$35.15 million | US$705/ton | +11.5% | +0.6% |
What the Rebound Says About Purchasing
RTM reads the August result as a return to selective replenishment after the June-July slowdown. The larger shipment volume, alongside a nearly unchanged average unit value, shows that additional business was moving without a large shift in the aggregate value per ton. This supports a recovery in purchasing activity, while the destination figures identify where that recovery was strongest.
Our current supplier-side observation adds another part of the picture: Crop 2026 production has started, yet buyers continue to place orders for Crop 2025. Both crop years remain active in purchasing discussions. Buyers with near-term requirements can still choose acceptable old-crop lots, while planning new-crop supply for later deliveries.
That helps explain why a new season can begin without an immediate break in the export-value trend. The crop transition is being driven by available stock, usable specifications, delivery timing and the economics of individual offers. RTM reads August's moderate recovery as consistent with this overlap in purchasing needs.
August Destination Markets: A Less Concentrated Recovery
August exports reached 66 destination markets, compared with 62 in July. The top three by export value were the Philippines (9.6%), Ghana (8.4%) and Italy (6.3%). The top-five share fell from 46.2% to 34.5%, and the top-ten share fell from 65.0% to 56.6%.
More markets recorded shipments and a larger share of value moved beyond the leading destinations. This broadening is useful evidence of renewed activity, although the regional gains remained uneven. For the longer perspective, see our review of China tomato paste export destinations.
Top August 2026 Export Destinations
August Share Changes Compared with July
Changes are percentage points of total export value.
The Gains Came from a Different Set of Markets
Ghana, United Kingdom, Italy, Oman and Cote d'Ivoire recorded the five largest increases in export value, adding a combined US$5.90 million from July. Across all destinations with increases, export value rose by US$12.52 million, offsetting US$8.70 million of declines elsewhere and leaving a net gain of US$3.82 million.
Russia recorded the largest fall in export value, down 54.7% from July. The Philippines remained the largest destination, although its export value fell 26.8%. Saudi Arabia declined 40.3% and the United Arab Emirates declined 10.5% by the same measure. August's growth therefore came alongside reduced shipments to several important July buyers.
August 2026 Top Destination Table
Top 15 destinations ranked by August export value.
| Rank | Destination market | August volume | August value | August value share | July value share | Share change |
|---|---|---|---|---|---|---|
| 1 | Philippines | 4,587 tons | US$3.37 million | 9.6% | 14.7% | -5.1 pp |
| 2 | Ghana | 4,587 tons | US$2.97 million | 8.4% | 4.3% | +4.2 pp |
| 3 | Italy | 3,644 tons | US$2.22 million | 6.3% | 3.7% | +2.6 pp |
| 4 | Japan | 2,117 tons | US$1.80 million | 5.1% | 5.7% | -0.6 pp |
| 5 | Saudi Arabia | 2,410 tons | US$1.77 million | 5.0% | 9.5% | -4.4 pp |
| 6 | South Korea | 2,319 tons | US$1.70 million | 4.8% | 3.9% | +1.0 pp |
| 7 | United Arab Emirates | 1,960 tons | US$1.57 million | 4.5% | 5.6% | -1.1 pp |
| 8 | Russia | 2,292 tons | US$1.52 million | 4.3% | 10.7% | -6.4 pp |
| 9 | Cote d'Ivoire | 2,198 tons | US$1.51 million | 4.3% | 1.9% | +2.4 pp |
| 10 | Senegal | 2,300 tons | US$1.48 million | 4.2% | 1.9% | +2.3 pp |
| 11 | United Kingdom | 1,798 tons | US$1.44 million | 4.1% | 0.4% | +3.7 pp |
| 12 | Oman | 1,637 tons | US$1.17 million | 3.3% | 0.5% | +2.8 pp |
| 13 | Thailand | 1,636 tons | US$1.11 million | 3.2% | 2.5% | +0.7 pp |
| 14 | Nigeria | 1,452 tons | US$1.04 million | 3.0% | 2.0% | +1.0 pp |
| 15 | Indonesia | 1,232 tons | US$0.93 million | 2.6% | 4.2% | -1.5 pp |
Regional Destination Mix
Africa Drove the Increase in Shipments
Shipments to Africa rose from 9,350 tons in July to 16,162 tons in August, an increase of 72.9%. The additional 6,812 tons exceeded China's total net increase of 5,150 tons. All other regions combined shipped 1,662 tons less than in July.
Africa's export value rose from US$5.91 million to US$10.91 million, lifting its share from 18.9% to 31.0%. Asia excluding the Middle East moved from 36.4% to 28.8%, while the Middle East and Gulf fell from 18.4% to 16.2%.
Europe also supported the rebound, adding 3,370 tons, led by Italy and the United Kingdom. Much of this increase was offset by a 3,211 tons decline in Eurasia/CIS, dominated by Russia. The regional picture is a redistribution of shipments with strong gains in Africa and Europe, alongside weakness in several previously large markets.
RTM reads the African increase as the clearest replenishment signal in August. Buyers should monitor whether this growth continues, alongside any recovery in the large Asian and Gulf destinations. Broader participation would strengthen the case for a sustained upturn.
Crop 2026 Has Started, and Crop 2025 Still Competes for Orders
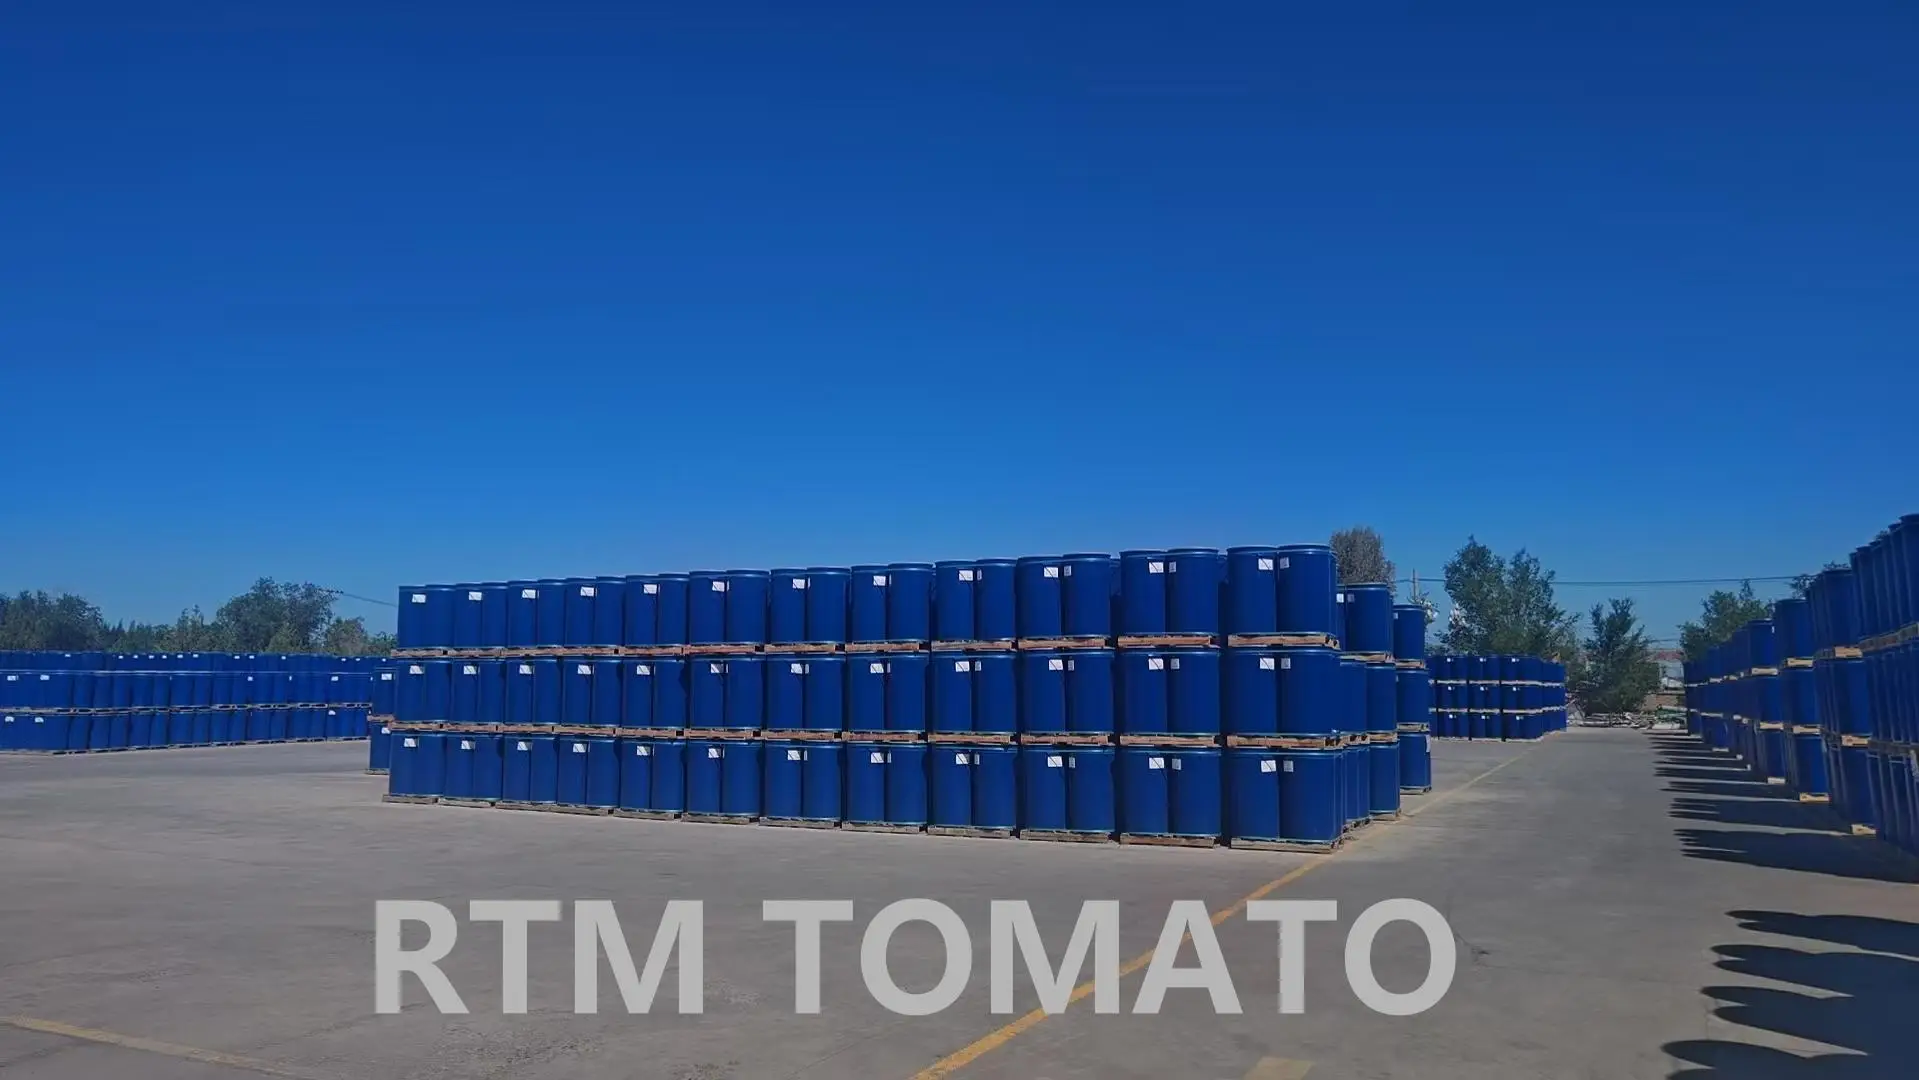
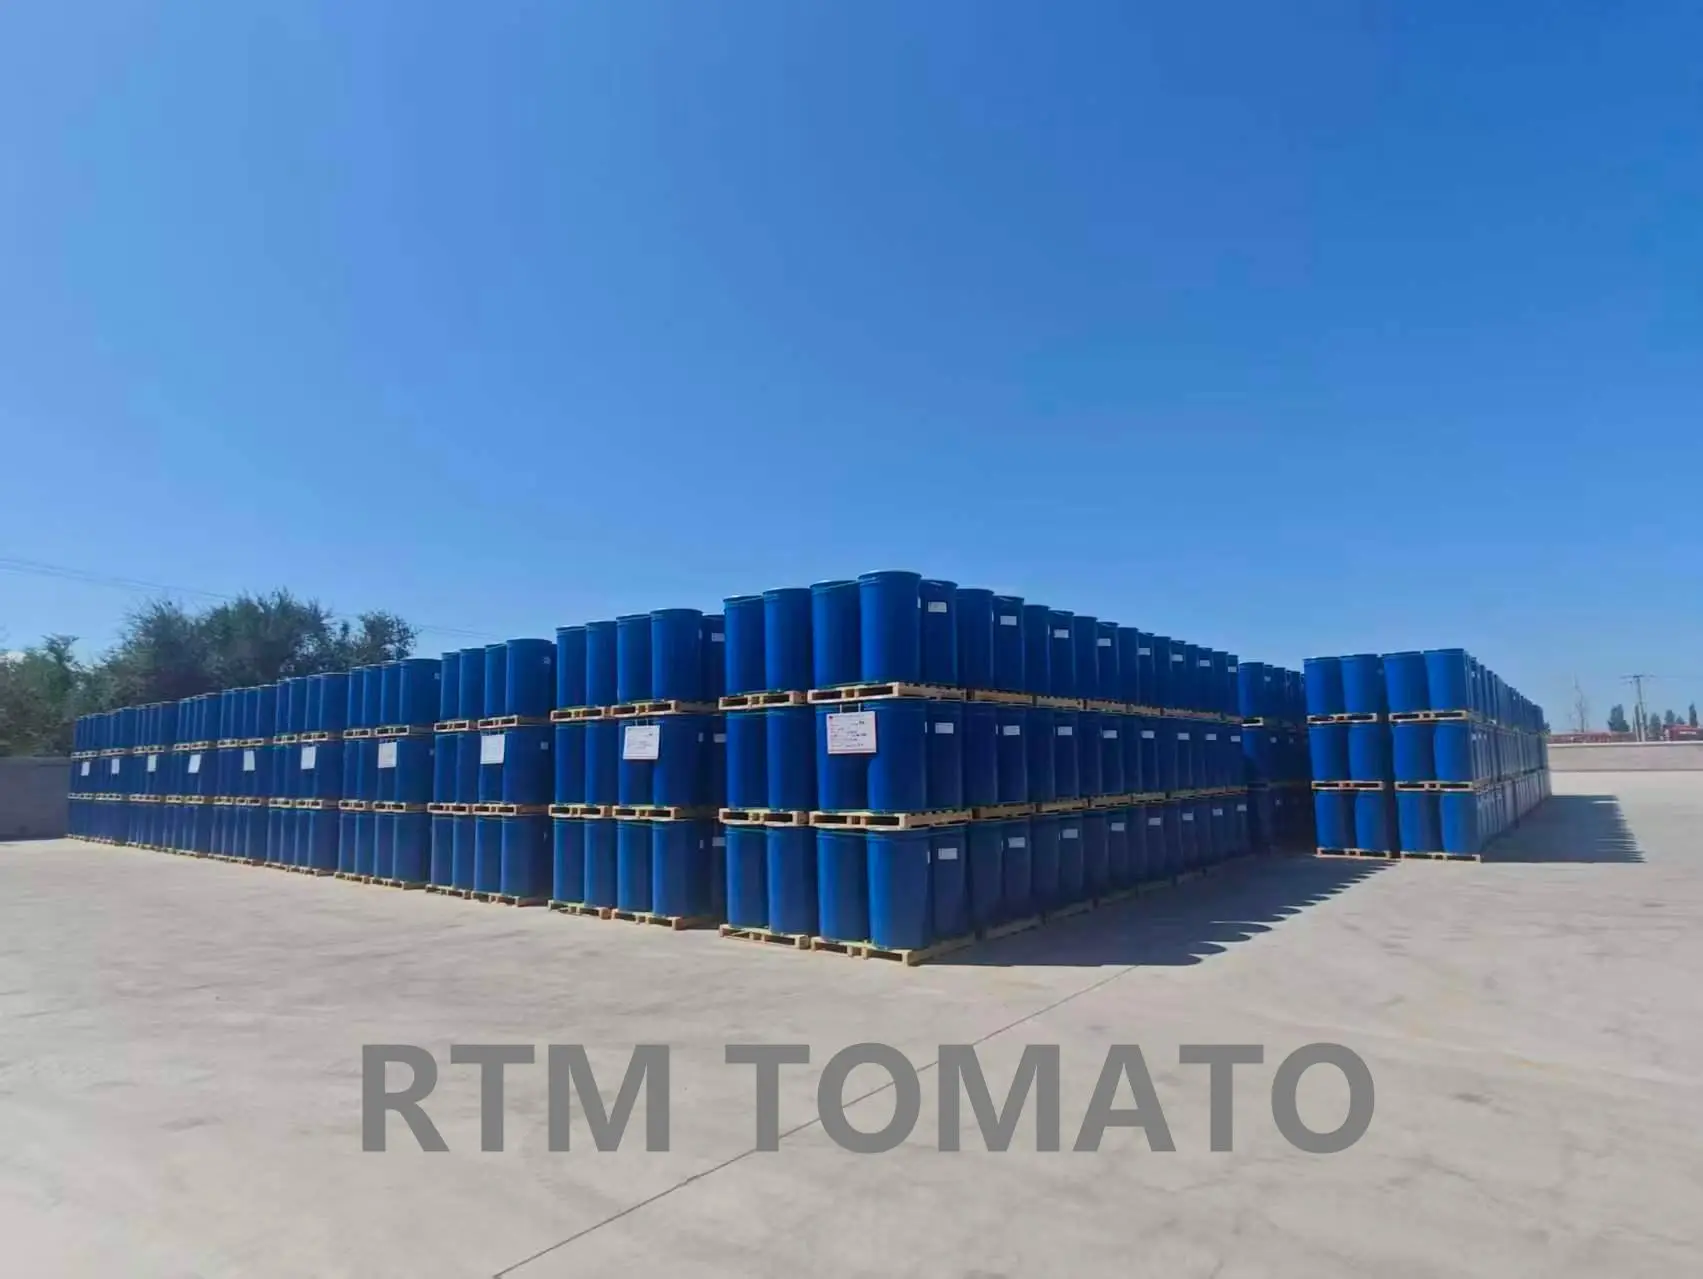
As of late September, Crop 2026 production is underway and factories are operating. RTM continues to see buyers booking Crop 2025 material. New-crop availability has added a purchasing option, while suitable carryover stocks retain a role in meeting current requirements.
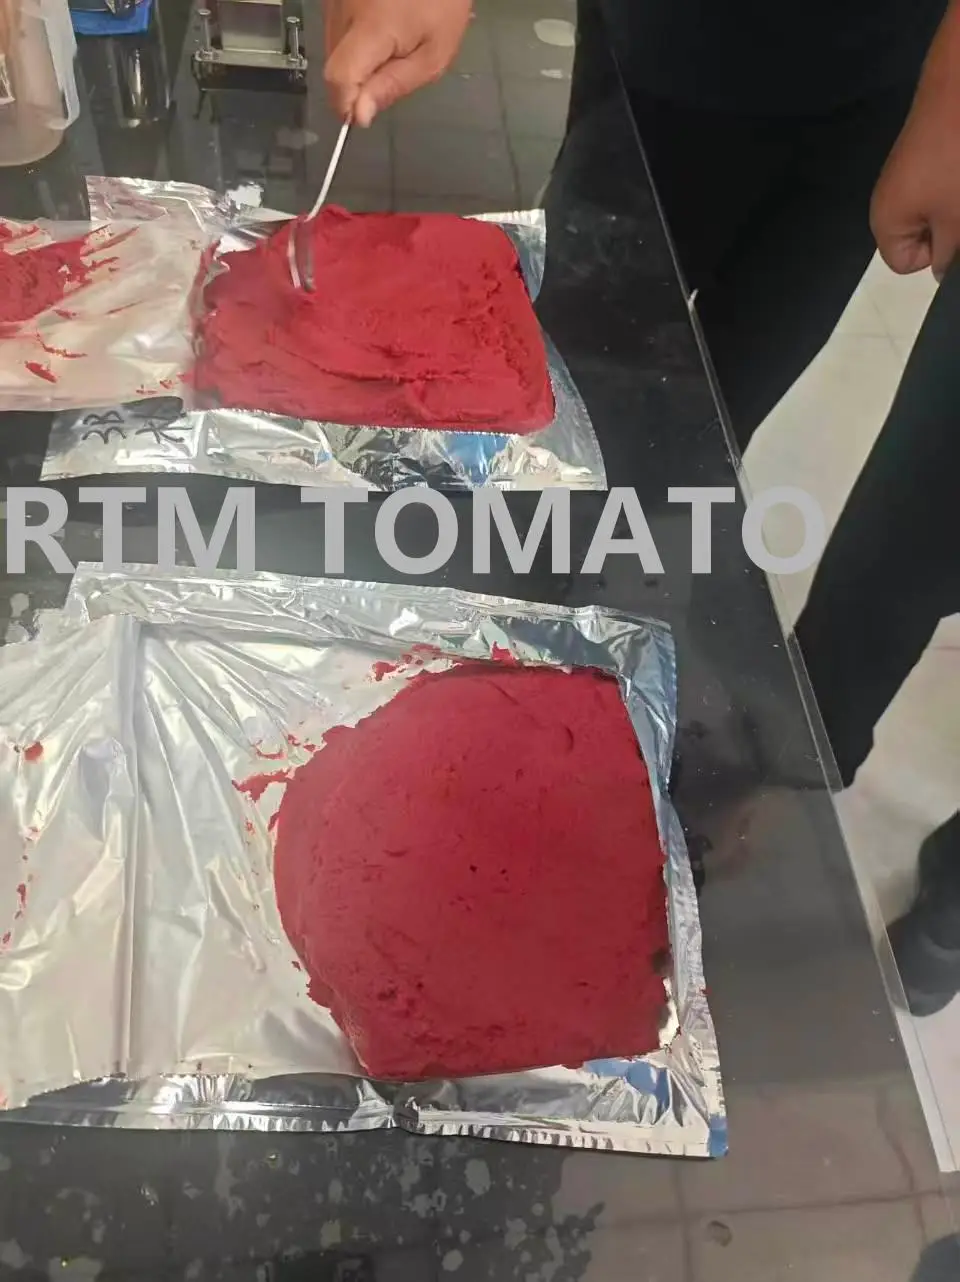
RTM sees three commercial reasons for that overlap: availability, suitable specifications and purchasing cost. An available lot with a workable loading date can meet an urgent replenishment need. Crop 2025 material that meets the buyer's Brix, color and processing requirements remains a usable production input. Comparing its delivered cost with a new-crop offer then allows the buyer to judge whether any premium is justified by the specification, remaining shelf life and delivery plan.
For pricing, the implication is direct: commercially usable Crop 2025 inventory keeps a competing offer in the market. This limits the scope for a broad Crop 2026 premium based only on the crop-year label. New-crop premiums are more likely to be negotiated around specific quality requirements, remaining shelf life or dependable supply windows. The degree of pressure will depend on which old-crop specifications and quantities are actually available.
For buyers, the opportunity is to compare the two crop years against the same requirement. Confirm production date, remaining shelf life, lot analysis, packaging condition and storage history for carryover material. For Crop 2026, confirm the specification, available quantity and loading schedule. Our article on Xinjiang's role in China tomato paste exports provides the wider supply-side background.
RTM is discussing Crop 2025 and Crop 2026 requirements with buyers. Share your target Brix, color value, processing type, packaging, quantity, destination port and delivery window so that the available options can be compared on a consistent basis.
Contact RTM for bulk tomato paste sourcingBuyer Takeaway
- Price both crop years against the same specification. Check delivered cost, lot quality, remaining shelf life, supplier reliability and contract terms before deciding whether an old-crop saving or a new-crop premium is worthwhile.
- Match purchases to the required arrival date. Separate immediate replenishment from later coverage and ask for confirmed loading windows. Production starting does not make every specification immediately available.
- Watch the breadth of the next recovery. Africa drove August's increase. Continued African shipments together with a recovery in major Asian and Gulf markets would provide stronger support for a sustained upturn. Use the customs average as a trend reference when requesting current quotations.
Price Interpretation Note
The average export unit values in this article are calculated from China Customs export value divided by export volume. They are used for market trend analysis only and do not represent RTM Tomato's actual quotation, nor the transaction price of any specific supplier, product, contract or shipment. Actual tomato paste prices may vary by Brix level, color value, processing type, packaging format, destination market, shipment timing, contract terms and product specification.
Data source: China Customs bulk tomato paste export data for January-August 2026, with matching 2025 aggregate data for year-on-year comparisons. The scope is tomato paste in containers weighing more than 5kg. Quantities are converted from kilograms to metric tons and values are in US dollars. Destination rankings, concentration and regional shares use export value. Regions follow the groupings used in RTM's July update, with Eurasia/CIS separate from Europe and the Middle East/Gulf separate from other Asia. Recorded destinations do not necessarily represent final consumption. The dataset does not identify crop year, order date or buyer inventory. Crop status and continuing Crop 2025 bookings are RTM supplier observations at the time of writing; the commercial explanations are RTM's analysis. Figures may differ slightly because of rounding.