This update extends our longer-term China tomato paste export data review and our analysis of China tomato paste export destinations.
Part 1 — July Volume and Average Export Unit Value
July was the second consecutive month of lower shipment volume. Exports fell by 5,416 tons from June to 44,693 tons, the lowest monthly total in January-July 2026. Export value declined by 10.3% month on month, broadly in line with the 10.8% volume decline.
The average export unit value moved only slightly, rising 0.6% from US$697/ton in June to US$701/ton in July. It was 4.7% above July 2025.
January-July 2026 Export Volume and Average Export Unit Value
Monthly export volume is shown in metric tons. Average export unit value is calculated from export value divided by export volume.
July and January-July Year-on-Year Comparison
Period averages are weighted calculations based on total export value divided by total export volume.
| Period | 2025 volume | 2026 volume | Volume YoY | 2025 avg unit value | 2026 avg unit value | Unit value YoY |
|---|---|---|---|---|---|---|
| July | 58,562 tons | 44,693 tons | -23.7% | US$669/ton | US$701/ton | +4.7% |
| January-July | 410,837 tons | 374,715 tons | -8.8% | US$663/ton | US$670/ton | +1.1% |
July export value was 20.1% lower year on year. For January-July, export value was 7.8% lower, compared with an 8.8% decline in physical volume.
January-July 2026 Monthly Data
| Month | Export volume | Export value | Avg export unit value | Volume MoM | Unit value MoM |
|---|---|---|---|---|---|
| January 2026 | 54,178 tons | US$36.95 million | US$682/ton | n/a | n/a |
| February 2026 | 50,919 tons | US$33.42 million | US$656/ton | -6.0% | -3.8% |
| March 2026 | 56,188 tons | US$38.21 million | US$680/ton | +10.3% | +3.6% |
| April 2026 | 58,811 tons | US$38.05 million | US$647/ton | +4.7% | -4.9% |
| May 2026 | 59,817 tons | US$38.32 million | US$641/ton | +1.7% | -1.0% |
| June 2026 | 50,109 tons | US$34.91 million | US$697/ton | -16.2% | +8.8% |
| July 2026 | 44,693 tons | US$31.34 million | US$701/ton | -10.8% | +0.6% |
How to Read the July Volume-Price Signal
January-July exports totaled 374,715 tons, with an export value of US$251.20 million and a weighted average export unit value of US$670/ton. Cumulative volume was 8.8% below the same period of 2025, while the period-average unit value was only 1.1% higher.
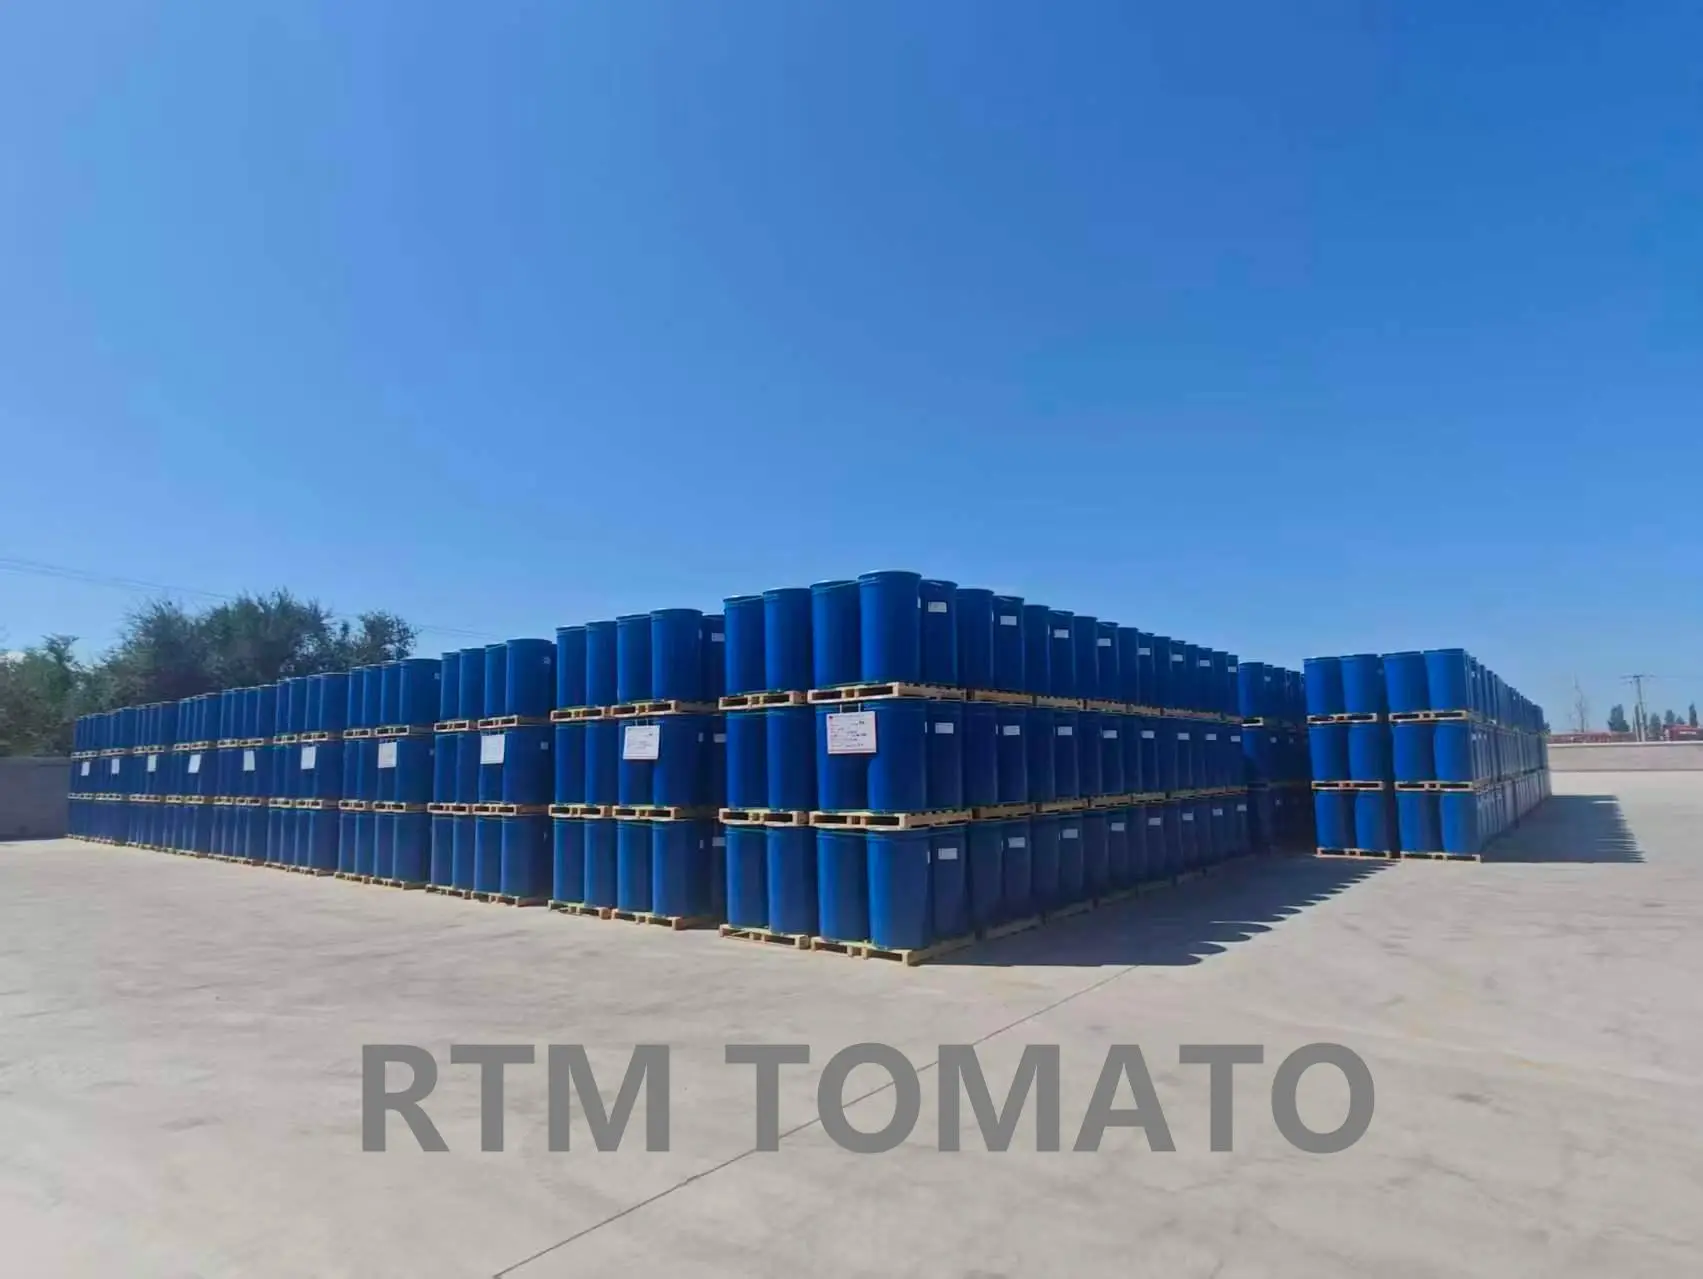
The June-July decline should be read in the context of the crop transition. RTM's supplier-side observation is that buyers were increasingly waiting for Crop 2026, while new-crop commercial cargo had not yet entered July export shipments. At the same time, available Crop 2025 inventory was moving toward its final stage. With buyers delaying part of their purchasing and no new-crop volume yet available to replace the old crop, exports fell from 59,817 tons in May to 50,109 tons in June and 44,693 tons in July—a two-month decline of 25.3%.
The calculated average export unit value moved in the opposite direction, from US$641/ton in May to US$697/ton in June and US$701/ton in July. RTM reads this divergence as a late-old-crop pattern: earlier inventory clearance had reduced the remaining supply, fewer tons were moving, and the customs average was no longer being pulled down by the same level of old-crop clearance activity. It does not mean that every specification or destination followed the same price path.
Part 2 — July Destination Markets
July exports were recorded across 62 destination markets, down from 65 in June. The Philippines remained first by export value with a 14.7% share, followed by Russia at 10.7% and Saudi Arabia at 9.5%.
The top-five share rose by 1.1 percentage points to 46.2%, and the top-ten share increased by 2.5 points to 65.0%. July therefore combined fewer recorded markets with a moderately more concentrated head of the ranking.
Top July 2026 Export Destinations
July Share Change Compared with June
A monthly share increase means a destination gained weight inside July's lower total; it does not necessarily mean end-market demand increased.
Gains Offset Part of a Broad Monthly Decline
The United Arab Emirates, South Korea, Cote d'Ivoire, Indonesia and Cameroon generated a combined US$3.18 million increase from June. These gains partly offset the five largest declines—Russia, Sudan, Poland, Thailand and the Philippines—which together reduced export value by US$4.28 million.
Russia remained the second-largest July destination despite a US$1.15 million monthly decline. The Philippines also remained first even though its export value fell by US$0.67 million. Rank persistence alongside lower absolute value is important: a leading share can be maintained in a contracting month.
July 2026 Top Destination Table
Top 15 destination countries by July export value. June share is included to show the monthly rotation.
| Rank | Destination country | July volume | July value | July share | June share | Share change |
|---|---|---|---|---|---|---|
| 1 | Philippines | 6,447 tons | US$4.60 million | 14.7% | 15.1% | -0.4 pp |
| 2 | Russia | 4,984 tons | US$3.36 million | 10.7% | 12.9% | -2.2 pp |
| 3 | Saudi Arabia | 3,833 tons | US$2.97 million | 9.5% | 8.3% | +1.2 pp |
| 4 | Japan | 2,095 tons | US$1.79 million | 5.7% | 4.5% | +1.2 pp |
| 5 | United Arab Emirates | 2,229 tons | US$1.76 million | 5.6% | 2.6% | +3.0 pp |
| 6 | Ghana | 2,361 tons | US$1.34 million | 4.3% | 4.0% | +0.3 pp |
| 7 | Indonesia | 1,614 tons | US$1.31 million | 4.2% | 2.2% | +1.9 pp |
| 8 | South Korea | 1,577 tons | US$1.21 million | 3.9% | 1.2% | +2.6 pp |
| 9 | Italy | 1,747 tons | US$1.17 million | 3.7% | 4.0% | -0.2 pp |
| 10 | Cameroon | 1,466 tons | US$0.89 million | 2.8% | 1.3% | +1.6 pp |
| 11 | Thailand | 1,096 tons | US$0.78 million | 2.5% | 4.3% | -1.8 pp |
| 12 | Vietnam | 953 tons | US$0.73 million | 2.3% | 2.1% | +0.2 pp |
| 13 | Nigeria | 931 tons | US$0.63 million | 2.0% | 3.3% | -1.3 pp |
| 14 | Senegal | 977 tons | US$0.60 million | 1.9% | 1.2% | +0.7 pp |
| 15 | Cote d'Ivoire | 866 tons | US$0.58 million | 1.9% | 0.0% | +1.9 pp |
Regional Destination Mix
July Shifted Toward Asia, the Middle East and Africa
Asia excluding the Middle East increased its share by 4.1 percentage points to 36.4%, supported by Japan, South Korea and Indonesia. The Middle East and Gulf gained 2.9 points, led by the United Arab Emirates, while Africa gained 3.3 points as Cote d'Ivoire and Egypt appeared in July and Cameroon increased.
Europe's share declined by 5.0 points and Eurasia/CIS by 3.7 points, reflecting lower shipments to Poland and Russia. These are changes in relative weight inside a smaller monthly total. They should not be read automatically as regional consumption growth or contraction, and country data records declared shipment destinations rather than guaranteed final consumption.
Part 3 — Crop 2026 Has Started: Plan New-Crop Sourcing Now
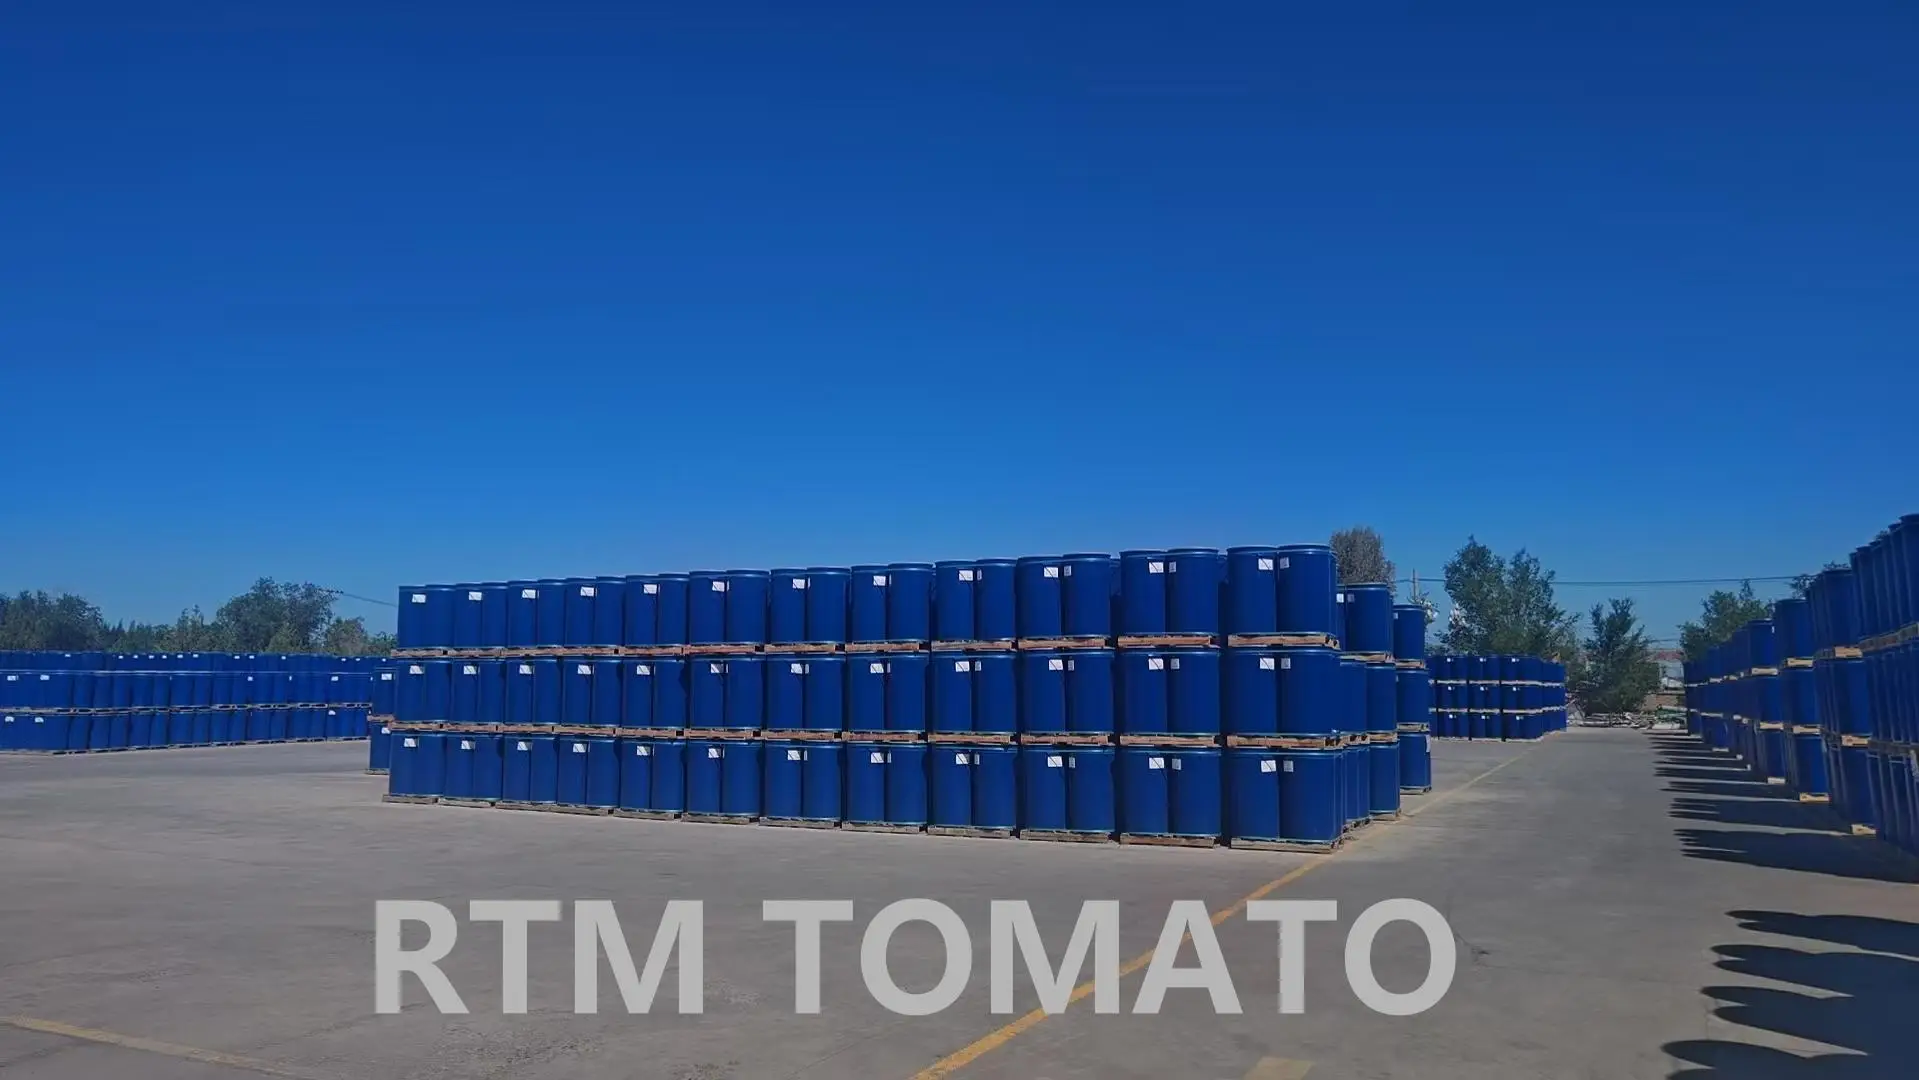
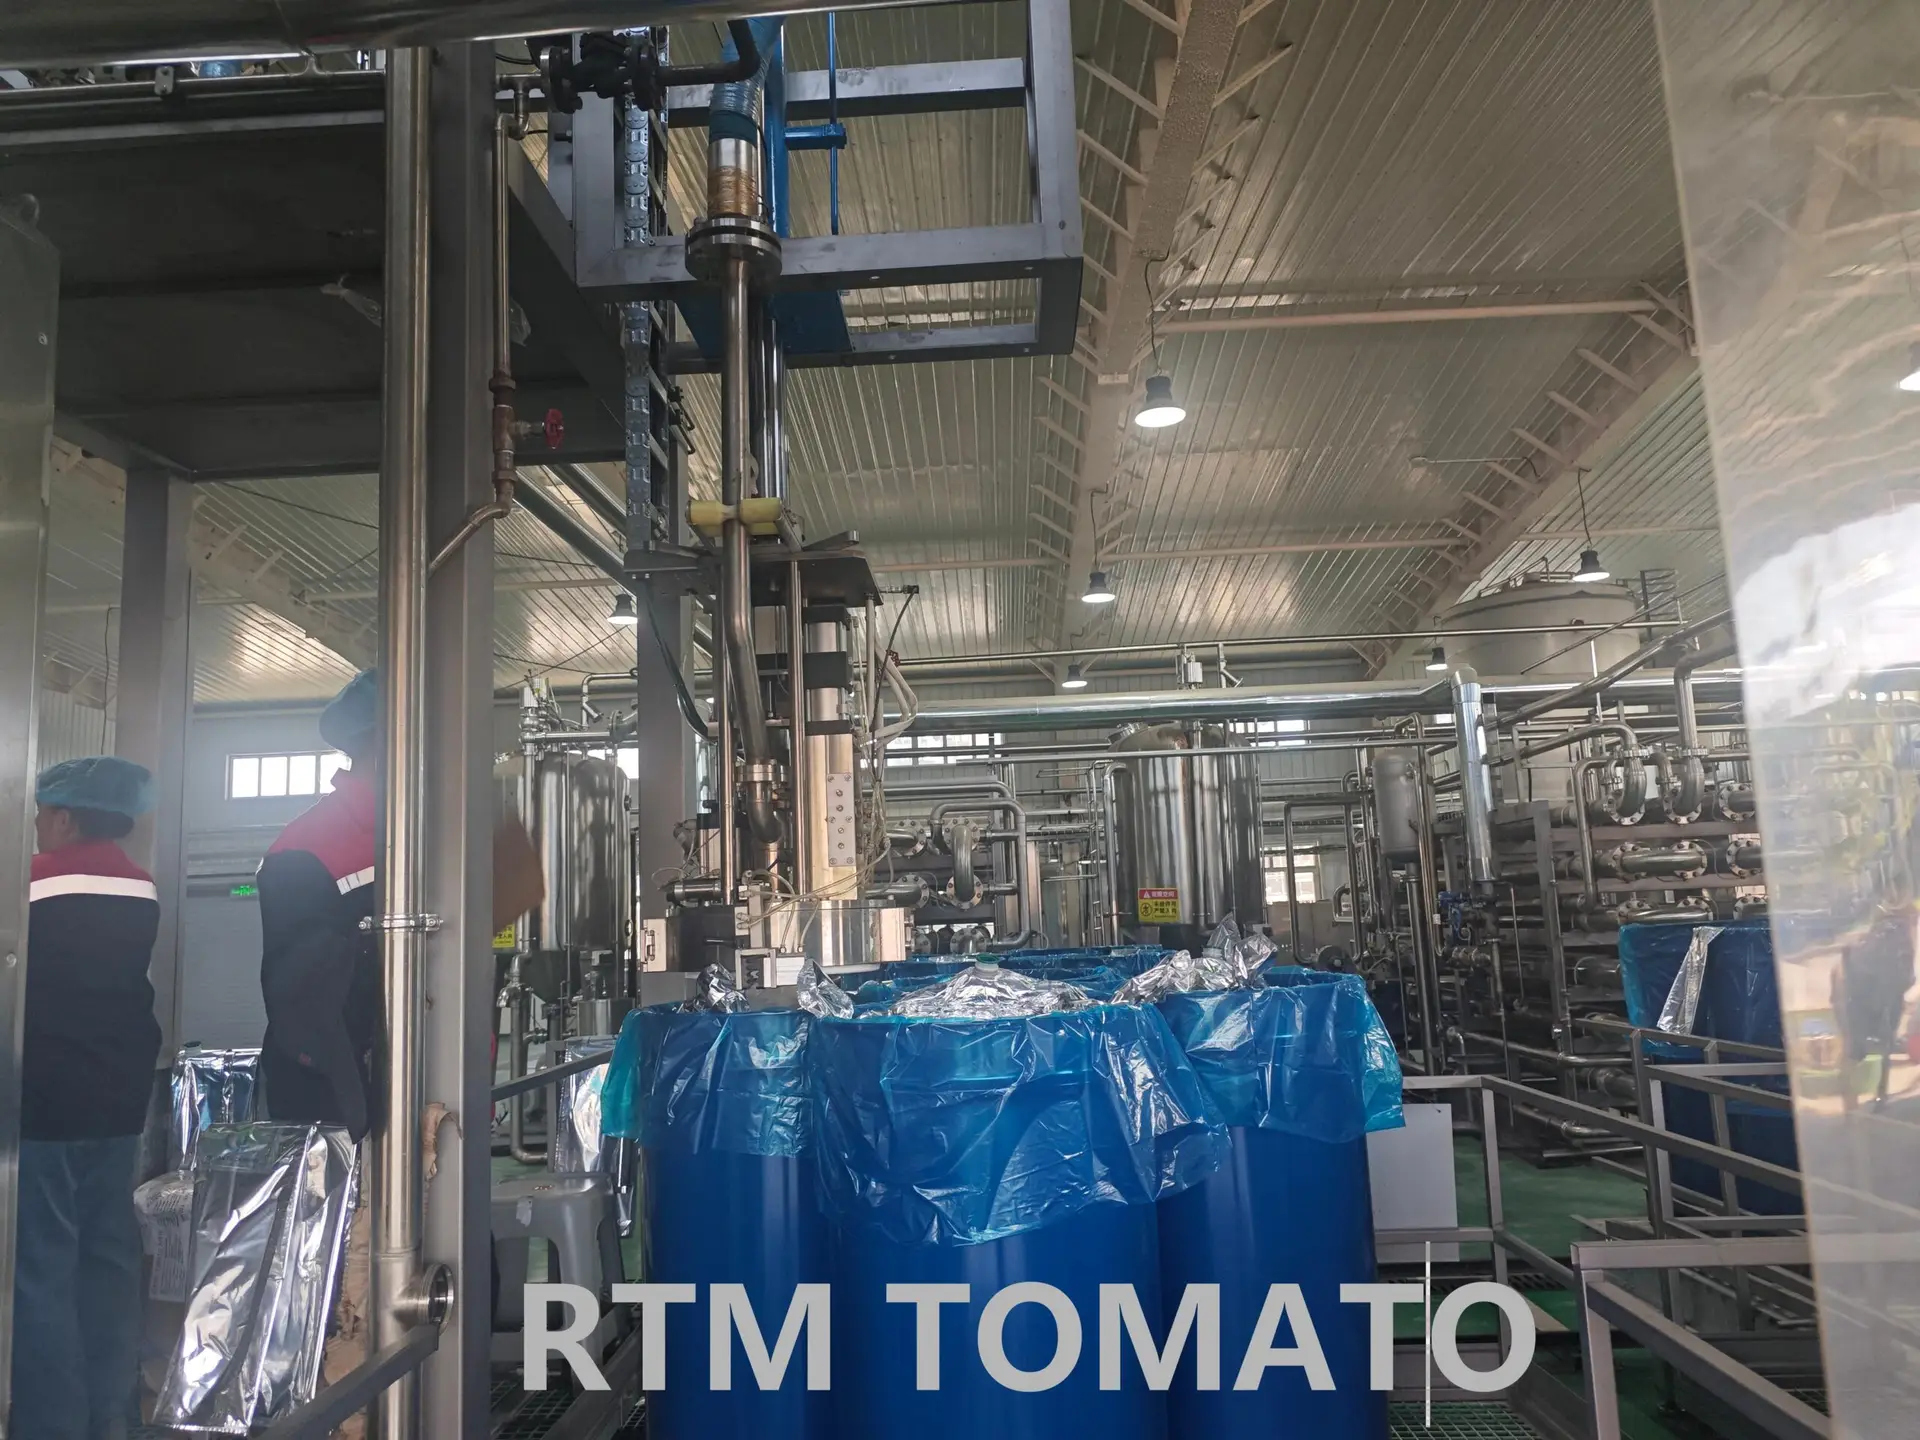
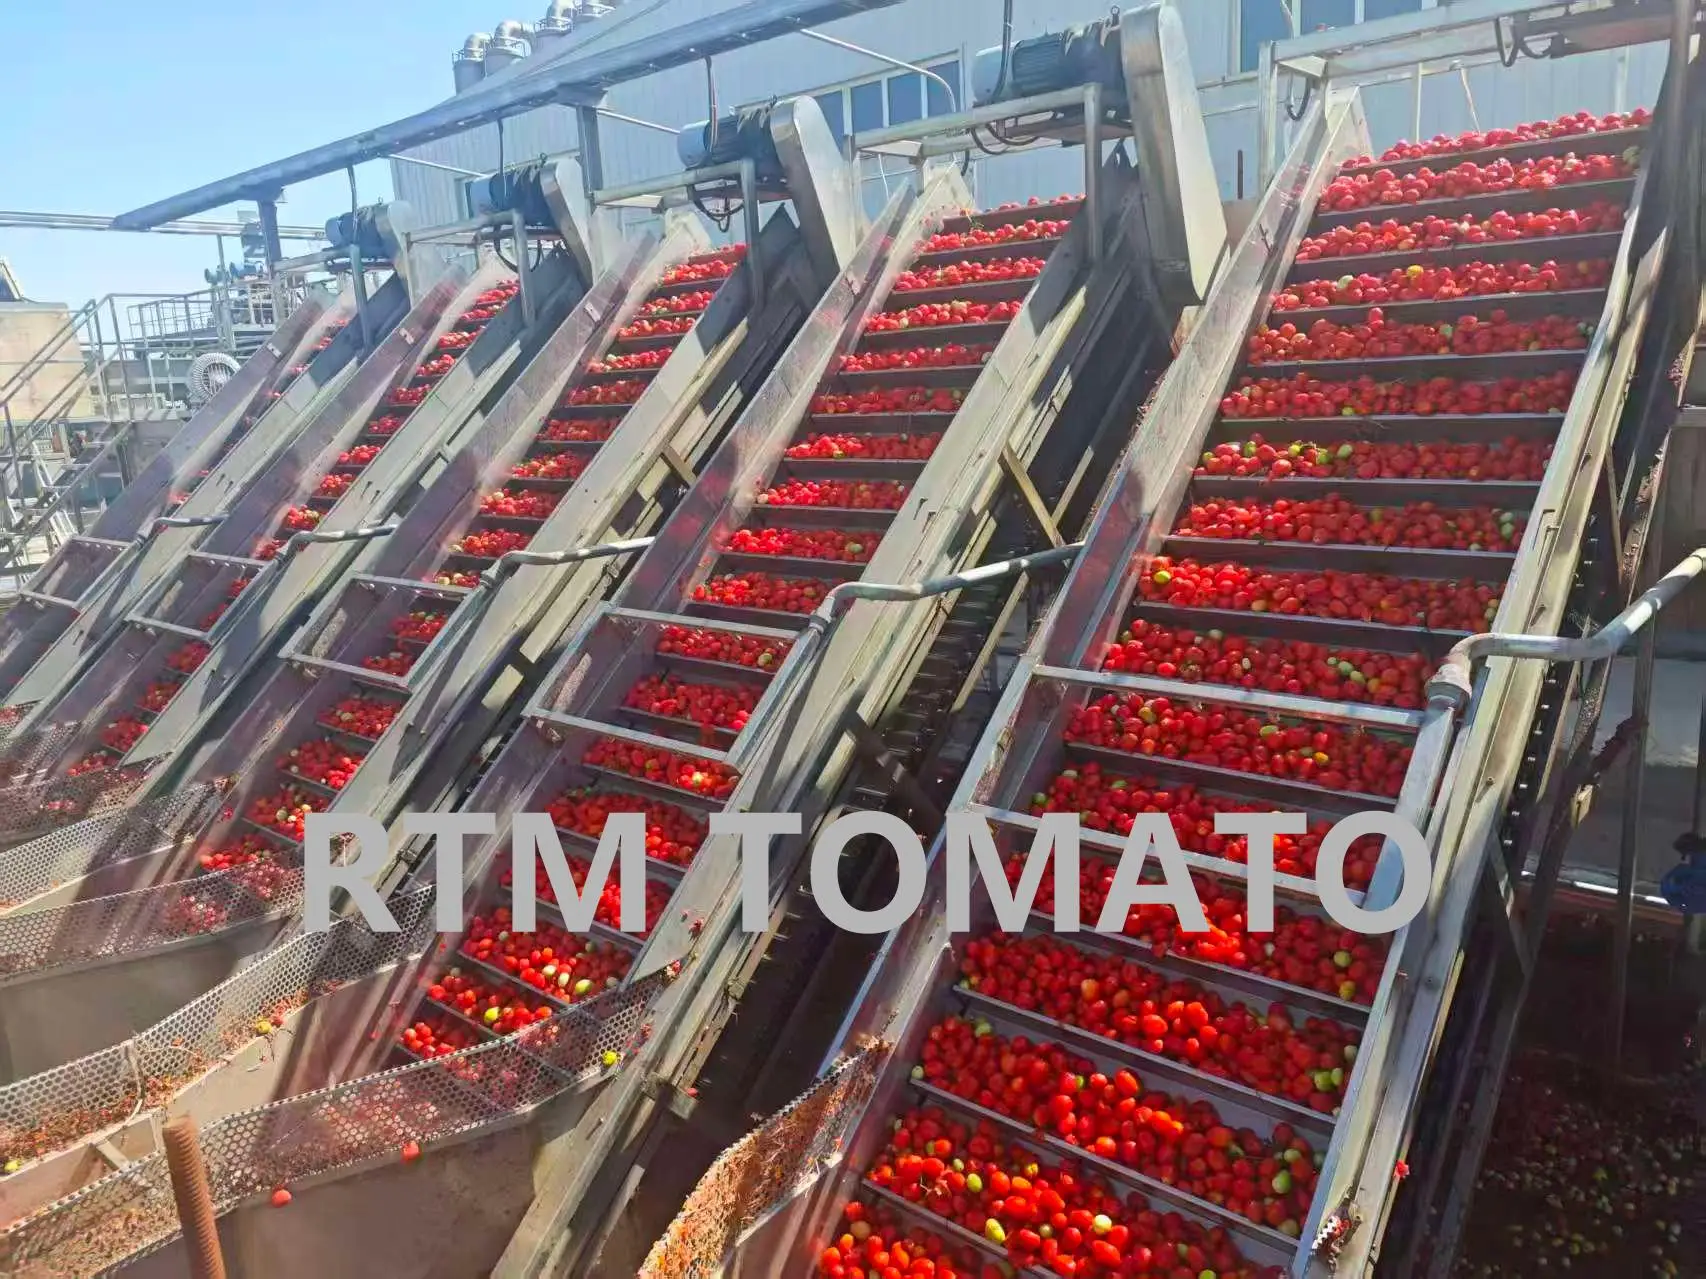
Crop 2026 production is now underway, and tomato-processing factories have started operating. The market has therefore moved from waiting for the new season to confirming actual production, specifications, allocation and shipment schedules.
This timing also explains why the July export data should not be used as a Crop 2026 price reference. July shipments still reflected the end of the previous crop cycle; new-crop production had not yet translated into July export volume. August and September data will begin to show how quickly Crop 2026 material enters export markets, but buyers do not need to wait for customs data before discussing current requirements directly with a supplier.
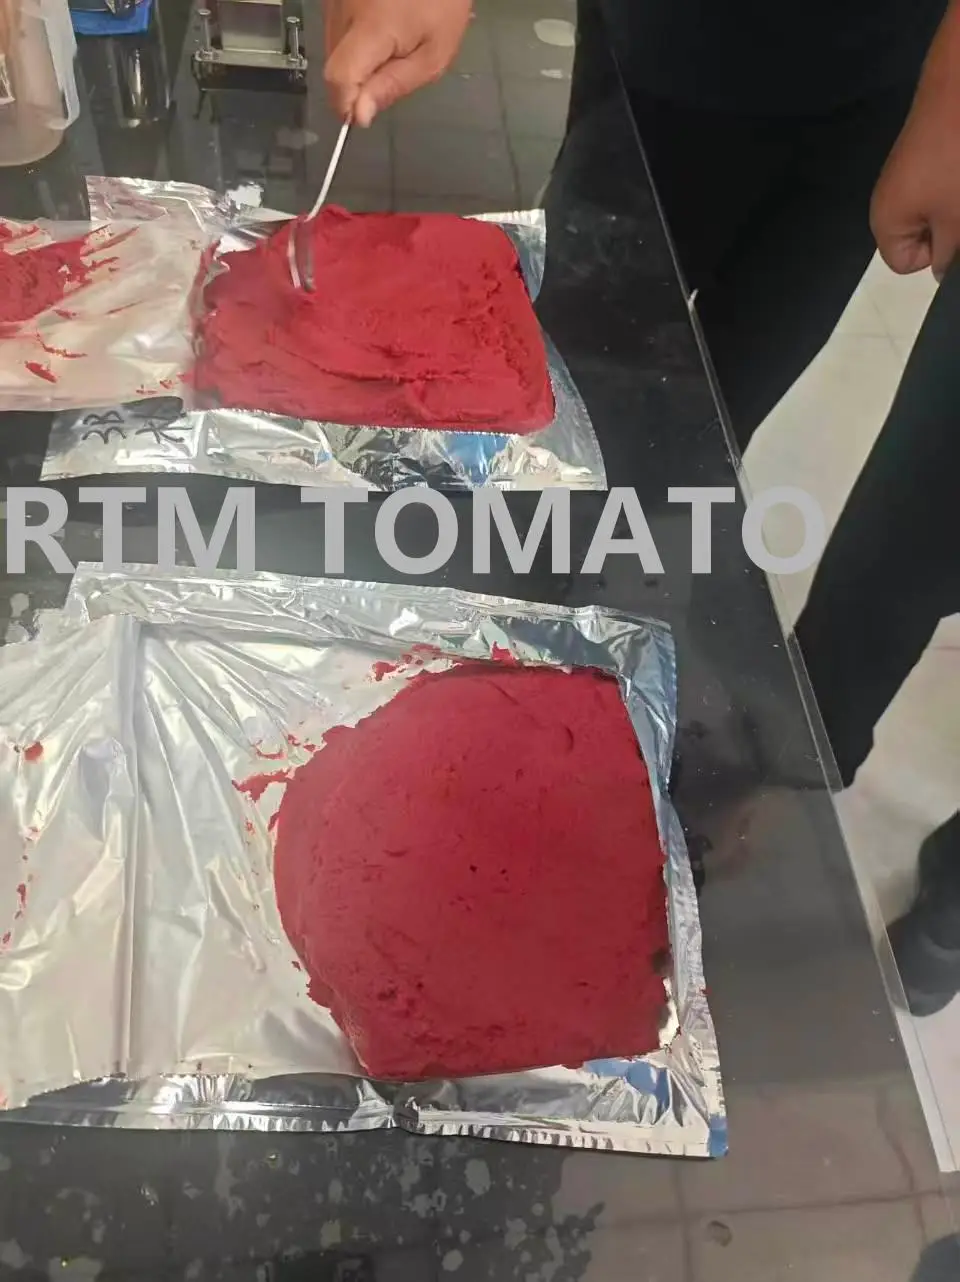
For buyers, this is the time to confirm crop year, Brix level, color value, processing type, packaging format, required quantity, loading schedule, destination port and contract terms. Production start does not mean every specification and loading window is immediately interchangeable, so early communication helps match the requirement with actual factory output and available shipment planning. For the broader supply-side background, see why Xinjiang is central to China tomato paste exports.
RTM is now discussing Crop 2026 supply with buyers. Importers, distributors and food manufacturers are welcome to share their target specification, quantity, destination and shipment window. We can respond based on current production, packaging options and the buyer's actual delivery requirement.
Contact RTM for Crop 2026 bulk tomato paste sourcing